 Buy Crypto
- Markets
 Futures
- Spot
- Copy Trade
- Earn
- More
Wall Street Collective Bearish on 2026, Will the Oil Crisis Trigger a Recession?


During the week of March 25, four institutions — Moody's Analytics, Goldman Sachs, JPMorgan, and EY-Parthenon — using different methodologies, coincidentally raised the probability of a U.S. recession in the next 12 months to over 30%. Moody's gave 48.6%, EY-Parthenon 40%, JPMorgan 35%, and Goldman Sachs 30%.
The event itself is more important than any specific number.
All Four Lines Moving Up Together
Moody's Analytics' machine learning model provided the highest reading. According to Fortune on March 25, Moody's Chief Economist Mark Zandi stated that this number was only 15% in December 2024, rose to 42% by the end of 2025, jumped to 49% in February this year, and the result of the latest round of calculations is 48.6%. Zandi expects the next round of data to likely push this number above 50%. The baseline recession probability is usually between 15% and 20%, and the current reading is nearly three times the normal level.
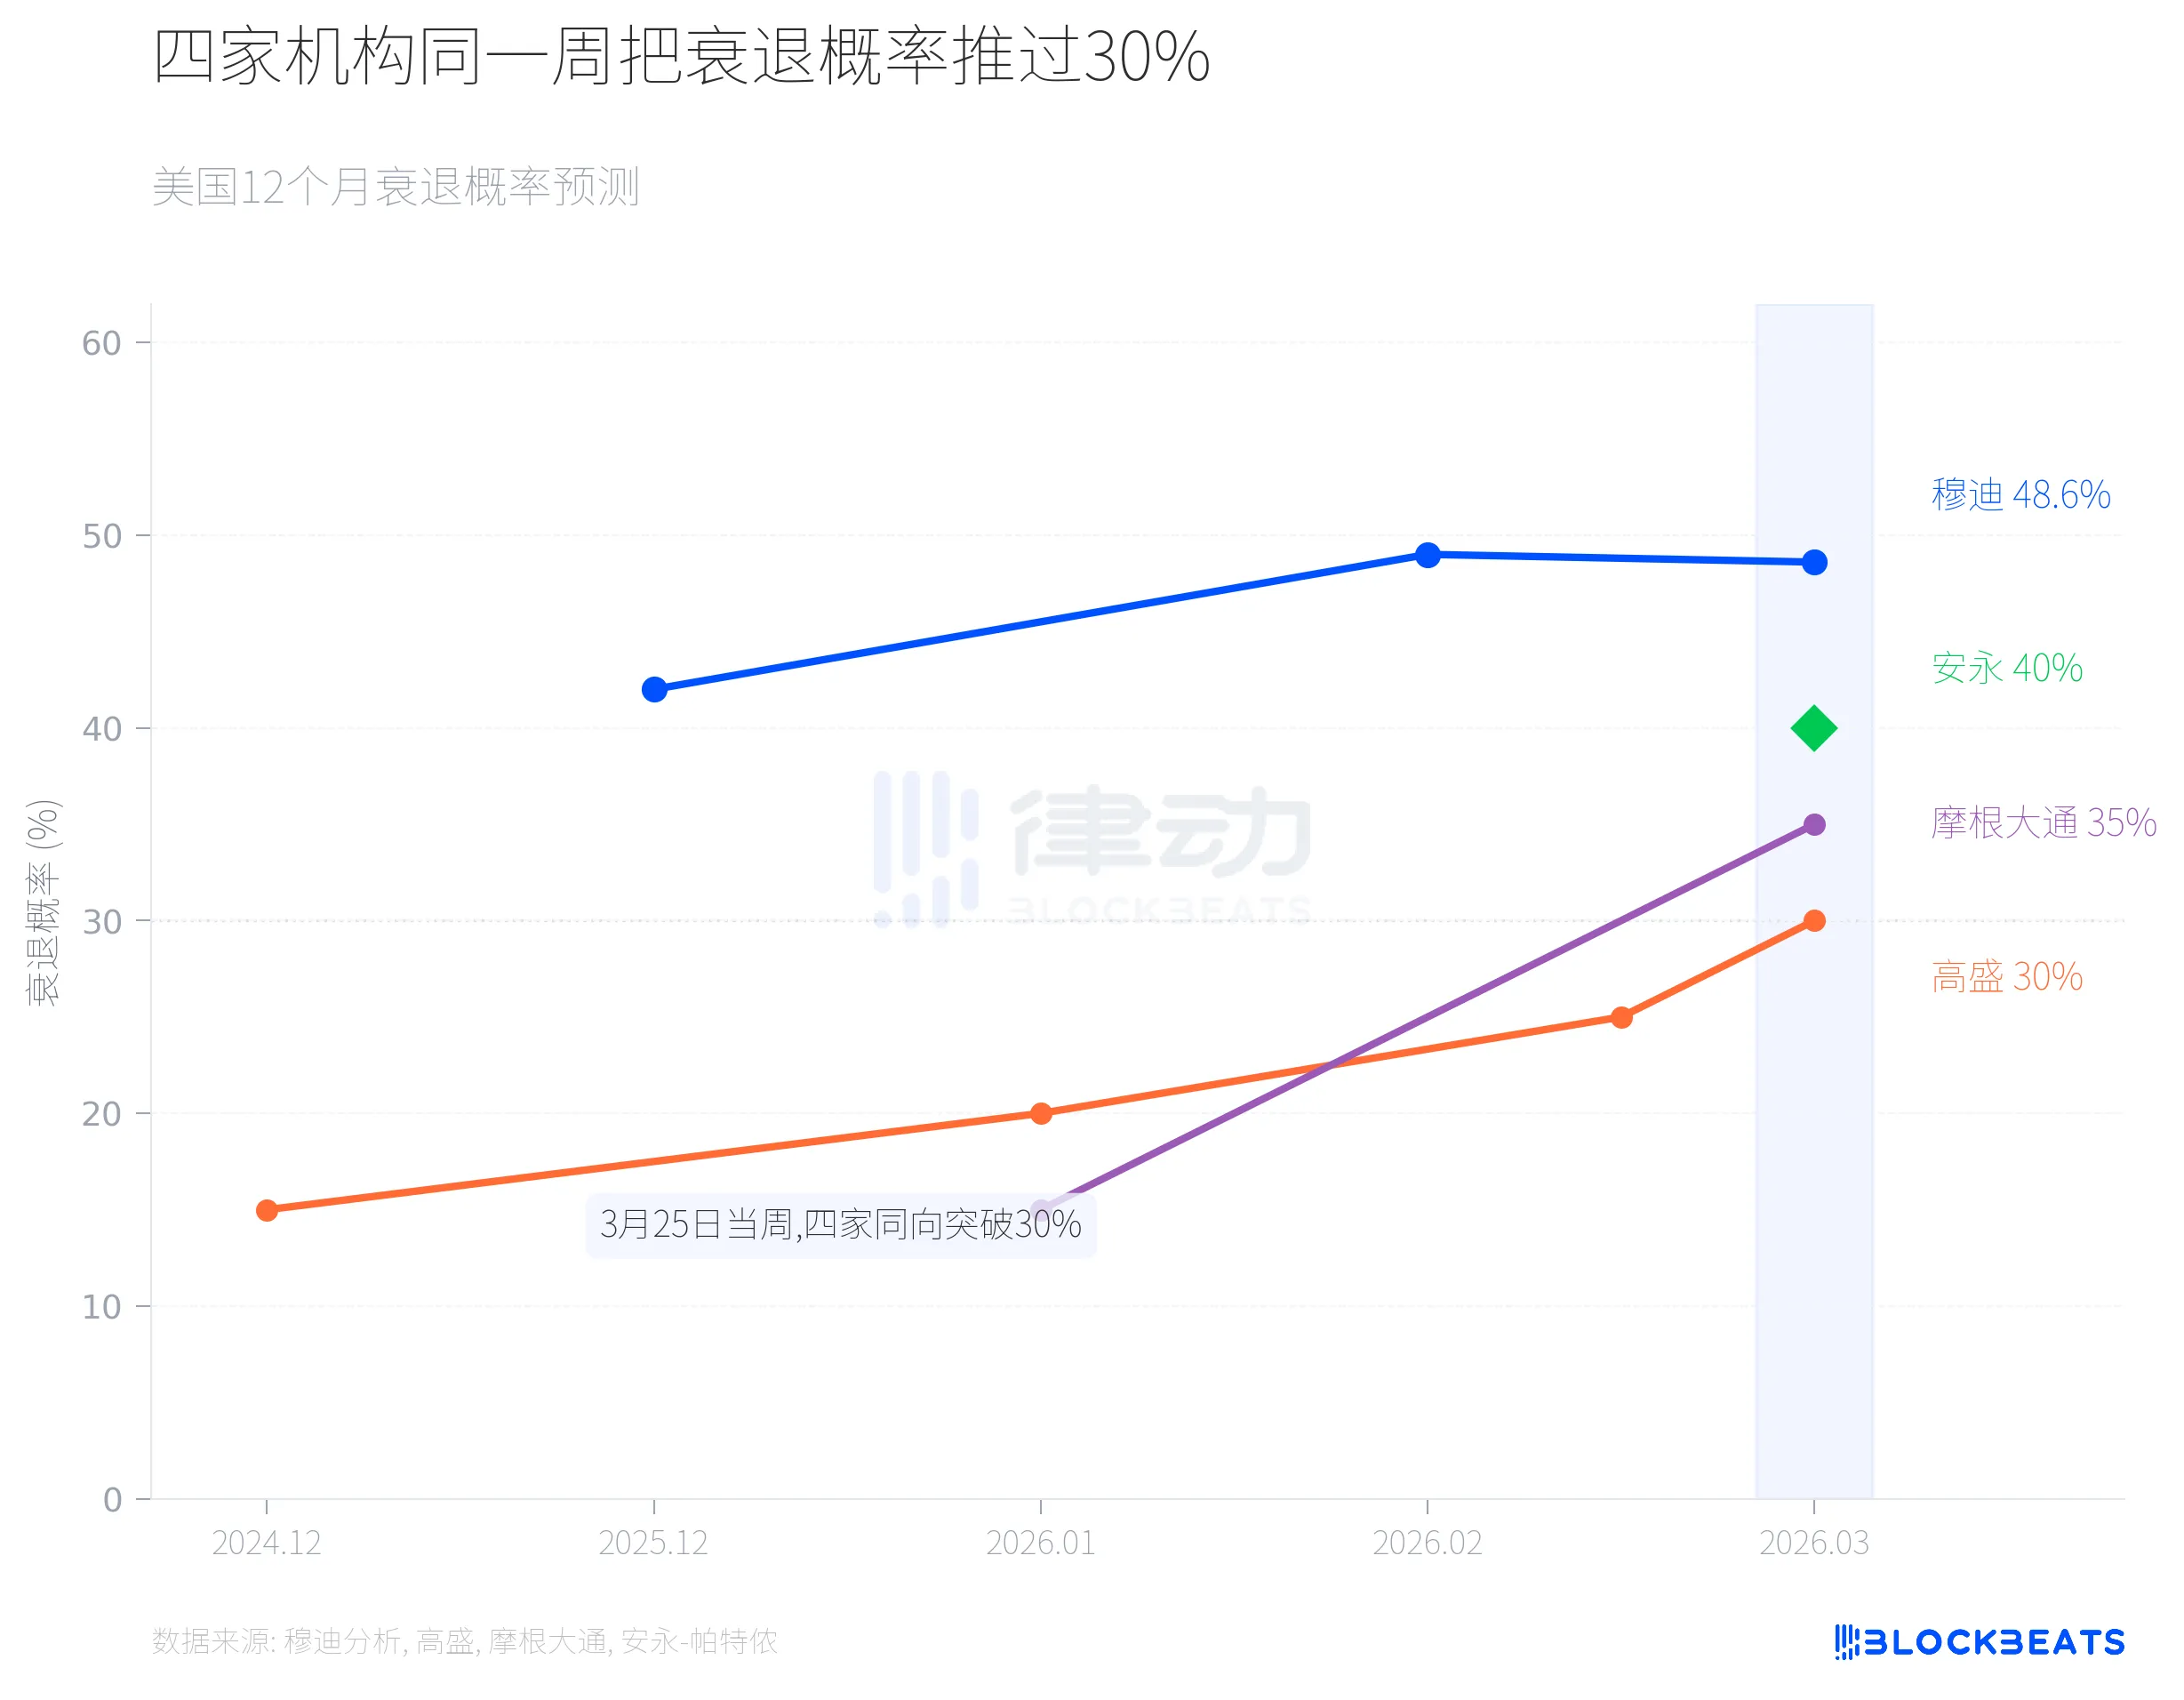
Goldman Sachs' path is similarly steep. According to Fortune, Goldman Sachs predicted 15% in December 2024, adjusted to 20% in January this year, raised to 25% on March 12, and reached 30% by March 25. The bi-weekly pace of adjustments is rare in Goldman Sachs' historical forecasts. Goldman Sachs also raised its PCE inflation forecast by 0.2 percentage points to 3.1%, lowered the full-year GDP growth forecast to 2.1%, and postponed the first rate cut expectation from June to September.
JPMorgan's global research gave 35%. According to CNBC on March 19, JPMorgan economists simultaneously lowered the S&P 500 year-end target price from 7500 points to 7200 points, with a possible drop to 6000 points in an extreme scenario.
EY-Parthenon was the last of the four to speak out, but the 40% probability it provided came with an interesting qualifier. According to World Oil on March 24, EY-Parthenon's Chief Economist Gregory Daco defined the current situation as a "multidimensional disruption," citing the impact not only on crude oil supply but also on refining systems, LNG infrastructure, and the fertilizer supply chain. This implies that even as oil prices fall, inflationary pressures will not diminish simultaneously.
Historical Success Rate of Oil Price Shocks
The core assumption of the four institutions has a common variable, oil price. Since the U.S. strike on Iran on February 28, Brent crude oil has surged from around $70/barrel, breaking $100 on March 8 (the first time in four years), and reaching as high as $115 last week. It closed at $102.22 on March 25.
According to the IEA March report, the Strait of Hormuz previously saw about 20 million barrels of crude oil pass through per day, accounting for approximately 20% of global seaborne oil trade. After the conflict broke out, Gulf countries' oil production was cut by at least 10 million barrels per day. Zandi estimated in an interview with Fortune that about one-third of the world's fertilizer supply also passes through this waterway.
This level of energy shock has occurred four times in history.
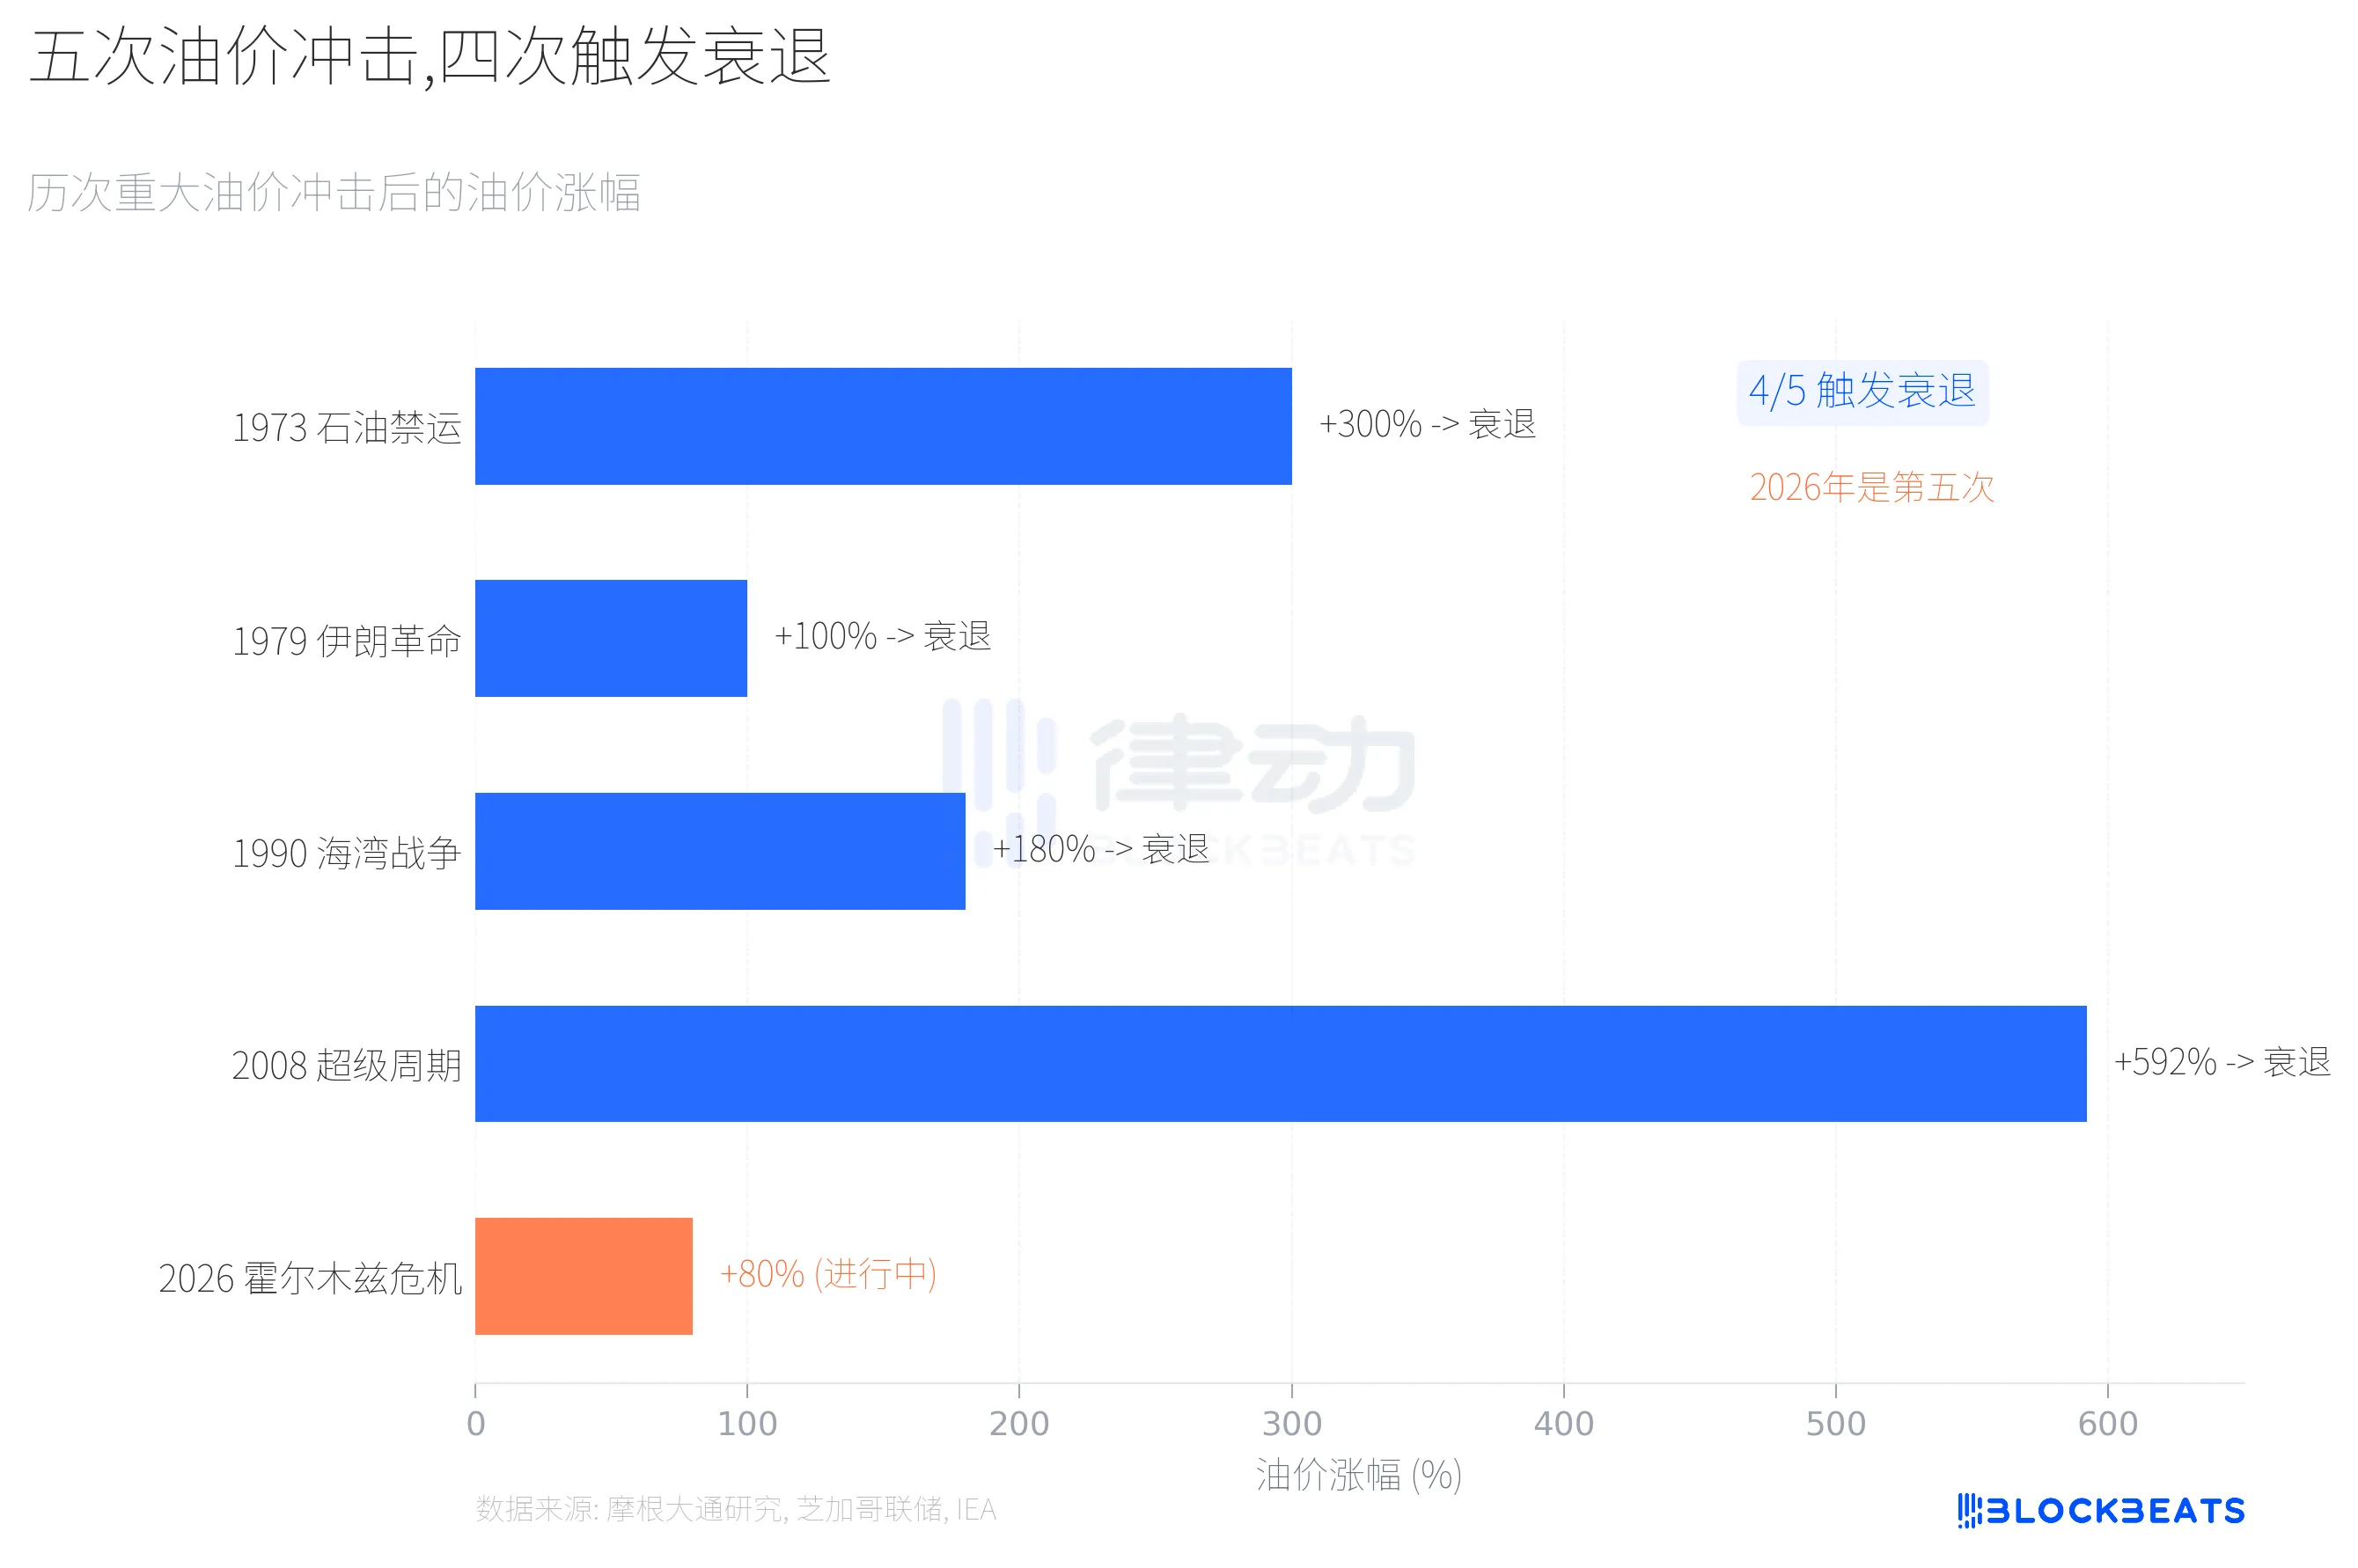
According to J.P. Morgan research, of the five major oil price shocks since the 1970s, four have been followed by a recession. The Yom Kippur War in 1973 led to a 300% surge in oil prices, and in November of that year, the U.S. entered a recession. The 1979 Iranian Revolution doubled oil prices, and the following January, the recession began. The Gulf War in 1990 drove a 180% increase in oil prices, and the recession almost immediately started. The supercycle from 2002 to 2008, with oil prices cumulatively rising by 592%, ultimately ended with the global financial crisis.
The current Strait of Hormuz crisis in 2026 has seen an increase of about 80%, the smallest of the five. But there is one key difference: the scale of this supply disruption is larger than any before. The IEA described it as the "largest disturbance to global energy supplies since the 1970s energy crisis."
J.P. Morgan economists provided a quantitative estimate: for every sustained 10% rise in oil prices, the drag on the U.S. GDP is about 15 to 20 basis points.
Fink's Duality
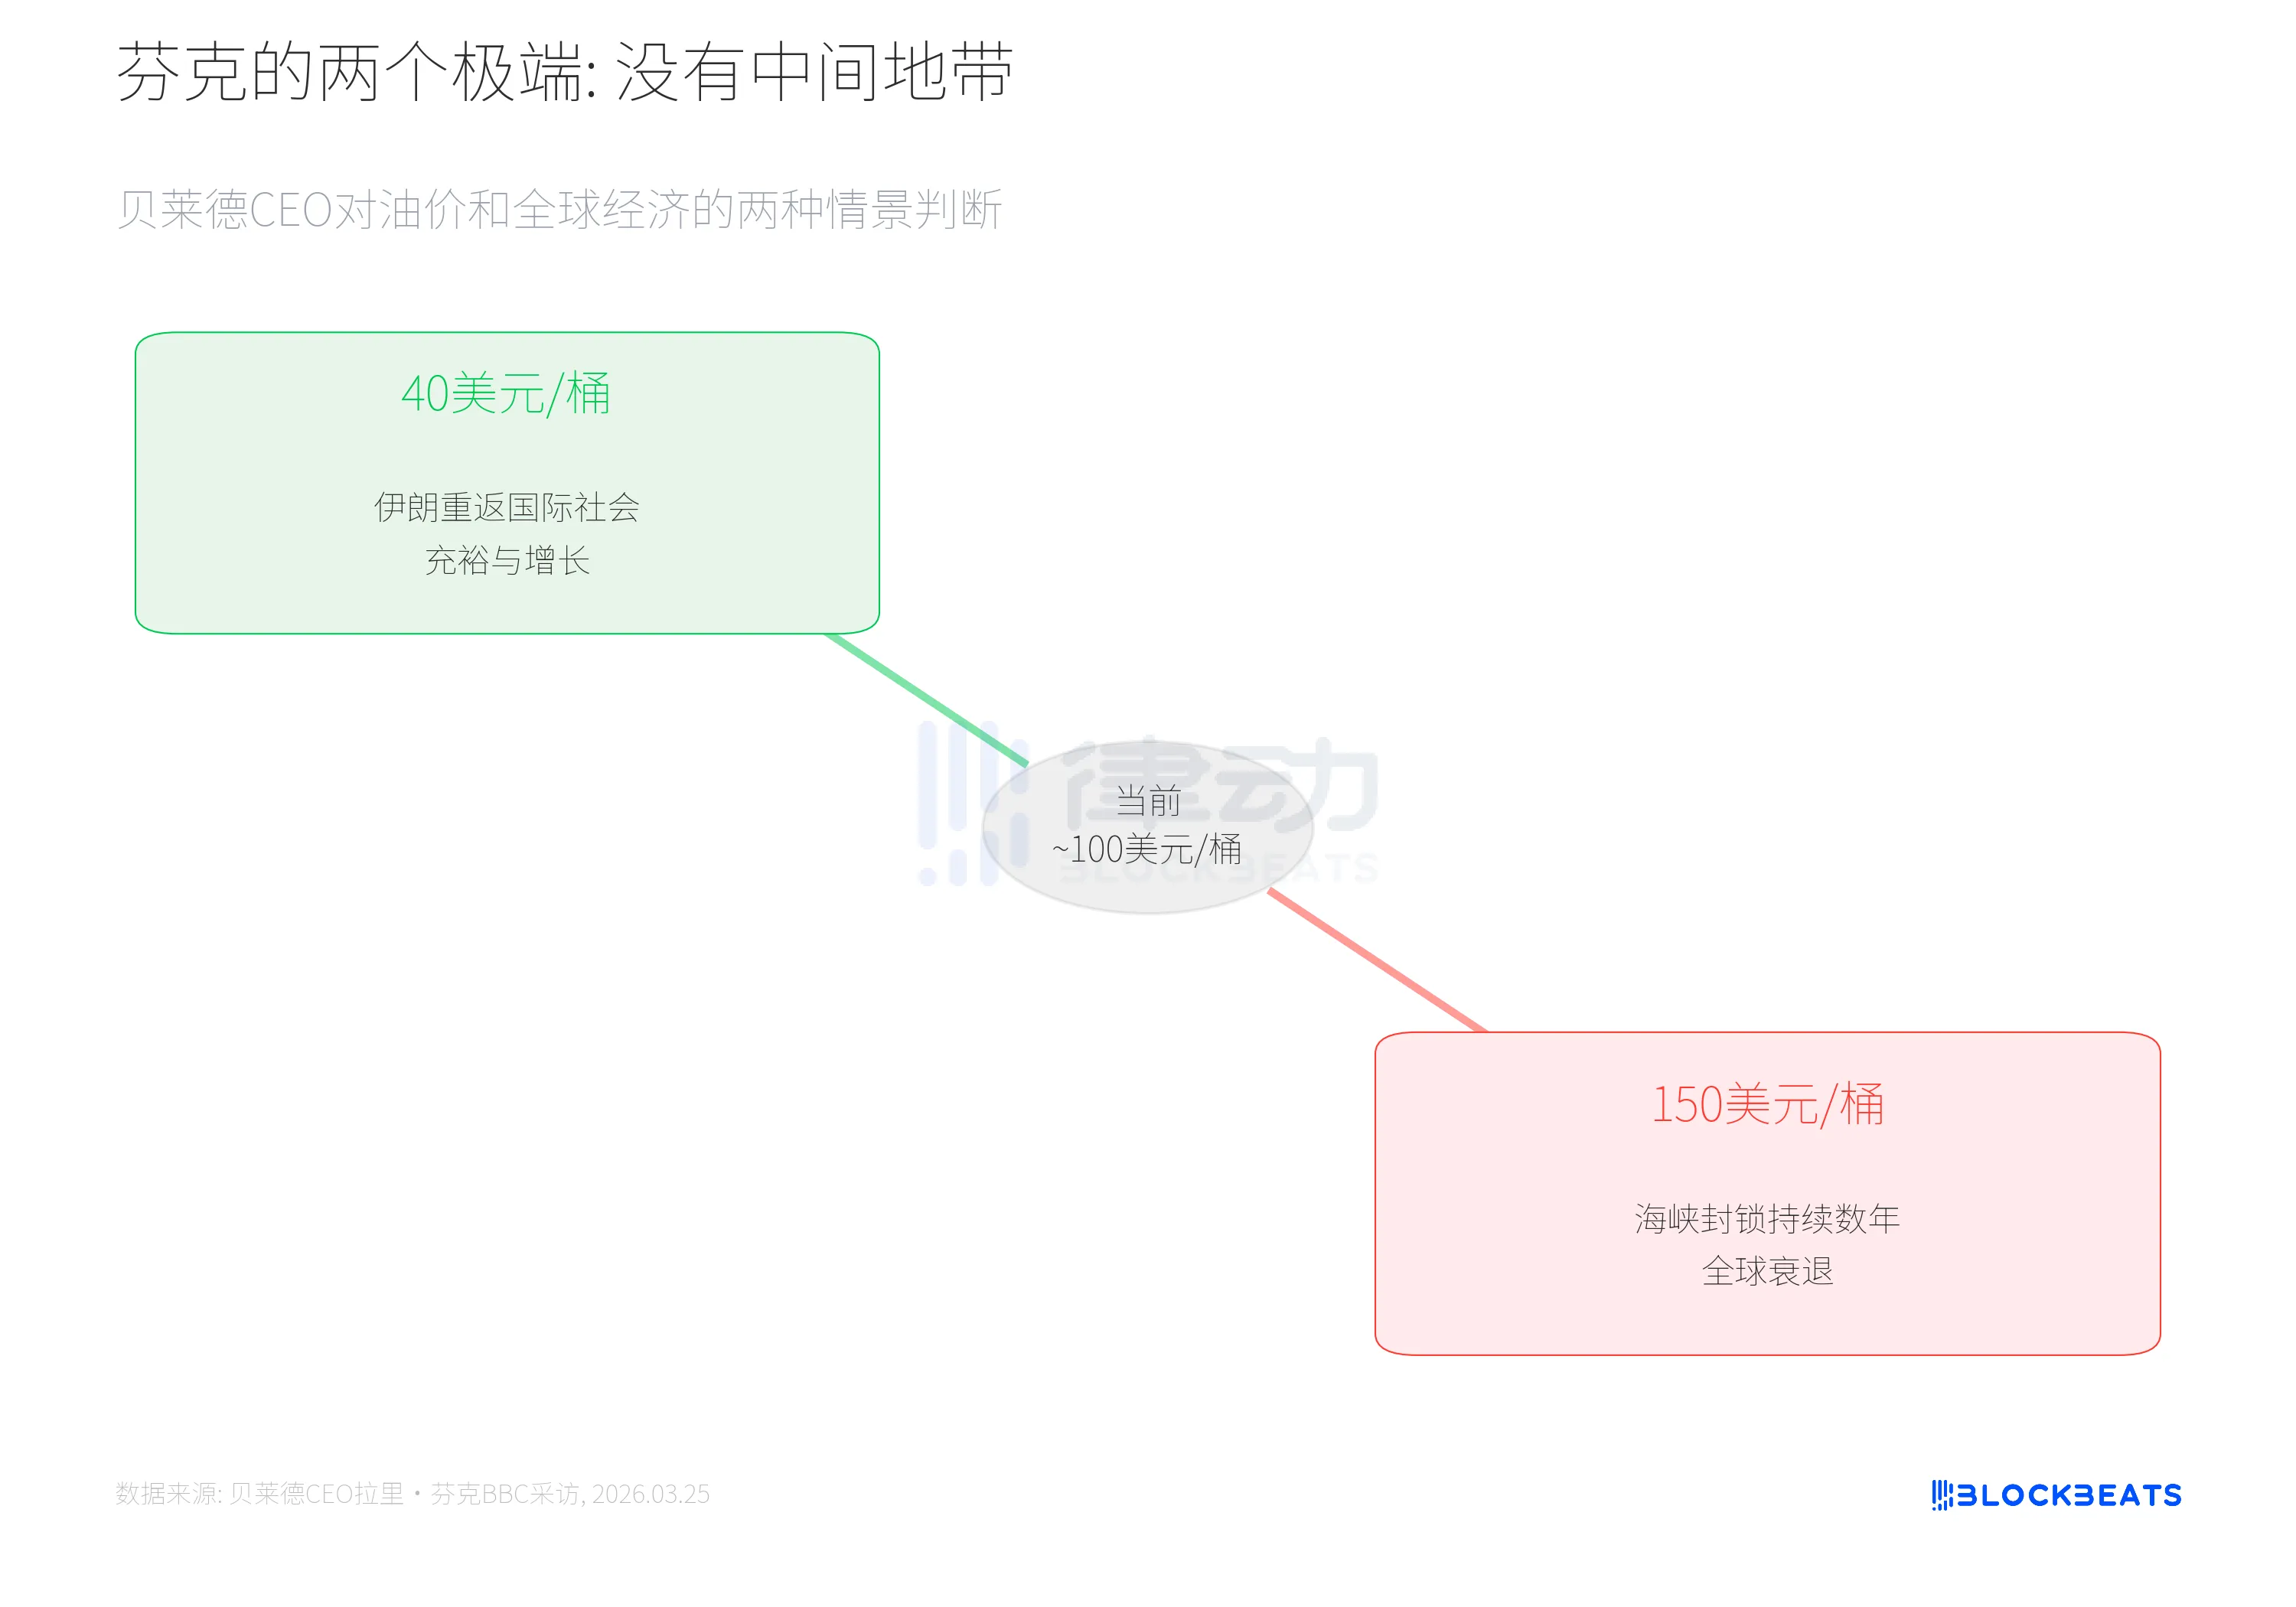
On March 25, Larry Fink, the CEO of BlackRock, who oversees over $10 trillion in assets, gave a more direct framework than numbers in an interview with the BBC.
According to Fortune, Fink said, "There will be no middle ground; the outcome will be one of two extremes."
In the first scenario, Iran is accepted by the international community, reengages in global trade, oil supply is restored, oil prices drop to $40/barrel, and the world sees growth. In the second scenario, the conflict persists, the strait remains blocked for years, oil prices are above $100 or even close to $150, and the world falls into recession. Fink specifically noted that the knock-on effects of high oil prices would transmit to agricultural products and fertilizers, as both are byproducts of natural gas.
However, Fink also ruled out one possibility, stating categorically that there would be no repeat of the systemic financial crisis seen in 2008, as the current capital adequacy of financial institutions is far higher than it was back then.
Consensus Itself Is a Variable
Back to the original question. Moody's uses a machine learning model, Goldman Sachs uses a macroeconomic forecasting framework, J.P. Morgan Chase tracks a five-factor index, and EY-Parthenon approaches it from a supply chain perspective. Four different methodologies that, in the same week, all converged in the same direction.
According to the University of Michigan March survey, the Consumer Sentiment Index has dropped to 55.5, placing it in the 2nd percentile historically. According to BLS data, the U.S. lost 92,000 nonfarm jobs in February, a reverse from the market's expectation of adding 60,000 jobs. Leisure and hospitality dropped by 27,000, healthcare by 28,000, manufacturing by 12,000, and federal government by 10,000. According to BLS statistics, since its peak in October 2024, federal government employment has been reduced by a cumulative total of 330,000, a decrease of 11%.
Zandi stated in an interview that if the average oil price reaches around $125 per barrel in the second quarter, "that would push us into a recession." With Brent currently around $102, there is still $23 to go before hitting that threshold.
The forecasts of these four institutions may not be accurate. However, when these four institutions arrive at similar conclusions using different methods in the same week, its impact is more than just a probability figure. This causes businesses to delay investment plans, consumers to tighten spending, and these behaviors, in turn, push down economic indicators, causing the next round of forecasted numbers to continue to rise.
You may also like

Michael Saylor: Winter is Over – Is He Right? 5 Key Data Points (2026)
Michael Saylor tweeted yesterday “Winter‘s Over.” It is short. It is bold. And it has the crypto world talking.
But is he right? Or is this just another CEO pumping his bags?
Let us look at the data. Let us be neutral. Let us see if the ice has really melted.

WEEX Bubbles App Now Live Visualizes the Crypto Market at a Glance
WEEX Bubbles is a standalone app designed to help users quickly understand complex crypto market movements through an intuitive bubble visualization.

Polygon co-founder Sandeep: Writing after the chain bridge chain explosion

Major Upgrade on Web: 10+ Advanced Chart Styles for Deeper Market Insights
To deliver more powerful and professional analysis tools, WEEX has rolled out a major upgrade to its web trading charts—now supporting up to 14 advanced chart styles.

Morning Report | Aethir secures a $260 million enterprise contract with Axe Compute; New Fire Technology acquires Avenir Group's trading team; Polymarket's trading volume surpassed by Kalshi

Why a Million-Follower Crypto KOL Chooses WEEX VIP?
Discover why top crypto KOL Carl Moon partnered with WEEX. Explore the WEEX VIP ecosystem, 1,000 BTC protection fund, and exclusive rewards for serious traders.

CoinEx Founder: The Crypto Endgame in My Eyes

Spark Coin (SPK): Explodes 73% as Aave Bleeds $15B, A Good Investment Now?
Spark coin (SPK) surged 73% as $15 billion fled Aave after the KelpDAO hack. This article explains what Spark is, why it’s pumping, and whether it is a good investment right now.

As Aave's building collapses, Spark's high-rise is rising

RootData: Q1 2026 Cryptocurrency Exchange Transparency Research Report

What Is Memecoin Trading? A Beginner's Guide to How It Works, the Risks, and 2026's Hottest Tokens
Memecoins surged 30%+ at the start of 2026 while Bitcoin was flat. RAVE spiked 4,500% then crashed 90% in days. MAGA jumped 350% overnight. This guide explains exactly how memecoin trading works — and how to not blow up your account doing it.

Trump Extends Ceasefire: Bitcoin Hits $79K — What Crypto Traders Need to Know Right Now
Bitcoin surged past $79,000 after Trump extended the ceasefire indefinitely. We break down exactly what happened, how every major crypto reacted, and what traders should watch next — including the one level that could unlock an $85,000 BTC rally.

CHIP Crypto Price Prediction 2026: Can USD.AI's GPU Lending Token Reach $1?
CHIP's 24-hour trading volume hit $1.87 billion on a $236 million market cap — an 8x ratio that almost never happens on legitimate tokens. We explain what's driving it, what USD.AI actually does for GPU tokenization, and whether CHIP belongs in your AI crypto portfolio.
RootData: Q1 2026 Web3 Industry Investment Research Report

USDC is the only AI token

The voice of a senior Polymarket user: In fact, we have already been surpassed by our competitors

Transcript of Dr. Han, founder of Gate, speaking at the University of Hong Kong: Breaking the Matthew Effect and Winning in Asymmetric Competition

Who will replace AAVE as the new king?
Michael Saylor: Winter is Over – Is He Right? 5 Key Data Points (2026)
Michael Saylor tweeted yesterday “Winter‘s Over.” It is short. It is bold. And it has the crypto world talking.
But is he right? Or is this just another CEO pumping his bags?
Let us look at the data. Let us be neutral. Let us see if the ice has really melted.
WEEX Bubbles App Now Live Visualizes the Crypto Market at a Glance
WEEX Bubbles is a standalone app designed to help users quickly understand complex crypto market movements through an intuitive bubble visualization.
Polygon co-founder Sandeep: Writing after the chain bridge chain explosion
Major Upgrade on Web: 10+ Advanced Chart Styles for Deeper Market Insights
To deliver more powerful and professional analysis tools, WEEX has rolled out a major upgrade to its web trading charts—now supporting up to 14 advanced chart styles.
Morning Report | Aethir secures a $260 million enterprise contract with Axe Compute; New Fire Technology acquires Avenir Group's trading team; Polymarket's trading volume surpassed by Kalshi
Why a Million-Follower Crypto KOL Chooses WEEX VIP?
Discover why top crypto KOL Carl Moon partnered with WEEX. Explore the WEEX VIP ecosystem, 1,000 BTC protection fund, and exclusive rewards for serious traders.
